Dashboard Research and Design · AGCO · 2018
The Passion Project that Inspired a Career Shift
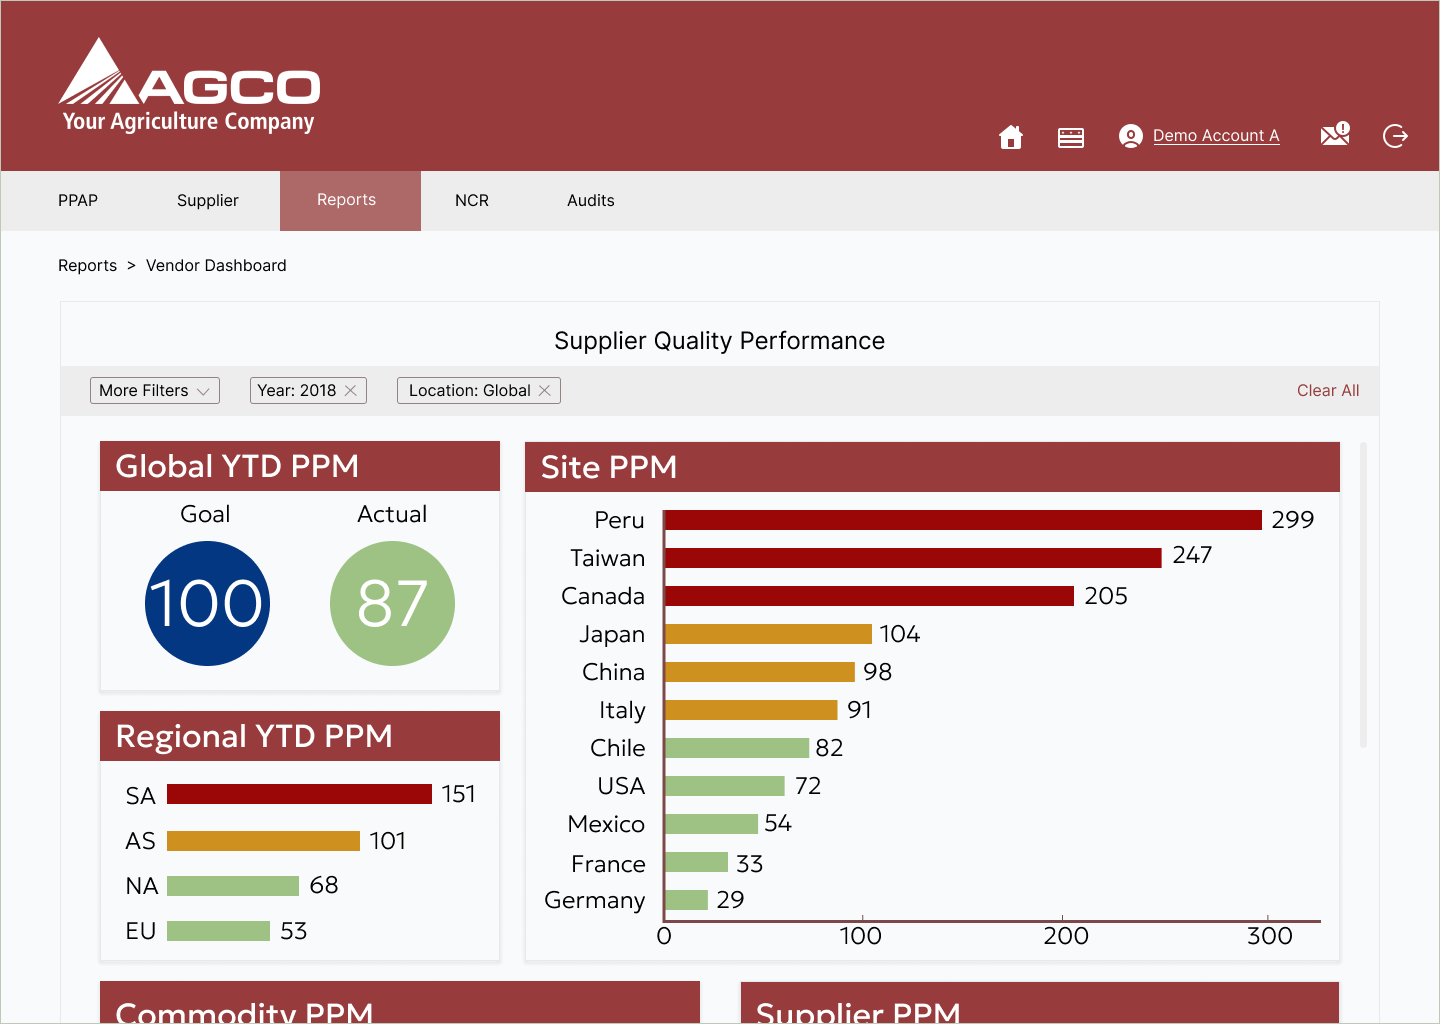
At AGCO, I was hired as an Engineer, but along the way I fell in love with user interviews, testing, and iterative designs. I created a dashboard to evaluate vendor performance, as my side project, and decided to expand it's reach as it became more popular. I conducted user interviews, usability tests, and A/B testing to establish the dashboard as a credible source for information on supplier KPI's.
- Company
- AGCO
- Role
- Global Supplier Quality Engineer
- Duration
- 5 months
- Methods
- User Interviews · Voice of Customer · A/B Testing · Usability Testing · Dashboard Design · Supply Chain
Strategic Recommendation
Design the dashboard around the decisions Engineers actually make, not the KPIs available.
Business Outcome
Global Parts Per Million quality metric improved by 150 points; dashboard still in use.
The Challenge
Problem statement and context.
Context
Buyers and quality engineers were meeting with vendors monthly to discuss performance, but each team pulled its own spreadsheet. Conversations became debates about the data instead of decisions about supply.
Business Goal
Reduce defective parts per million globally and create a single source of truth for vendor conversations.
Customer Problem
Buyers didn't distrust the numbers. They distrusted that everyone was looking at the same numbers. Meetings stalled at reconciliation.
Research
Understanding the domain.
Research Questions
- —What decision is the buyer trying to make in a vendor meeting?
- —Which metrics move that decision, and which are noise?
- —Where does trust in the number break down?
Methods and Participants
12 stakeholder interviews · Shadowing 4 vendor meetings · A/B testing 3 dashboard variants
Buyers, quality engineers, supplier development managers across 4 regions
Key Insights
Buyers wanted a defensible starting point, not a full picture
In every meeting observed, the first 10 minutes were spent aligning on which number was correct.
Trend mattered more than magnitude
"Is it getting worse" drove more decisions than "how bad is it."
Strategy
Framing the solution.
Core Insight
The dashboard's job was to end reconciliation, not to display everything. Framing it as a decision instrument. Not a report. Changed every downstream choice.
Strategic Opportunities
- Standardize the top-of-page metric across all users
- Lead with trend, drill into magnitude on demand
- Bake the vendor-conversation flow into the dashboard's structure
Recommendations
- Anchor every view on a single, agreed-upon KPI
- Design meeting-mode: a printable frame that mirrors the digital view
- Deprecate the six competing spreadsheets rather than integrate them
Decision Making
Design direction and validation.
Direction
Leadership agreed to sunset legacy reports and adopt the dashboard as the system of record for vendor reviews.
Validation
A/B testing across two regions before global rollout.
Business Impact
What changed after the work shipped.
Global Parts Per Million improved by 150 points in the year following launch
Reduced average vendor-meeting prep time from 90 to 20 minutes
Dashboard is still the system of record seven years later
Reflection
What I took from this engagement.
"The technical work was modest. The strategic work. Getting five teams to agree on one number. Was the entire project."